S&P 500, Dollar, USDJPY, Consumer Price cpi, and Earnings Talking Points.
The market's eventual reaction to the September US inflation report deviates significantly from the basic trends we have learned to expect for this vital data series.
There are several hypotheses being advanced to explain the increase in the S&P 500 and other risky assets during the previous session. Still, I feel the most important takeaway was the volatility that was eventually displayed.
Priority is given to fundamentals, although systemic market factors might distort the interpretation. I have a saying: volatility breeds volatility.
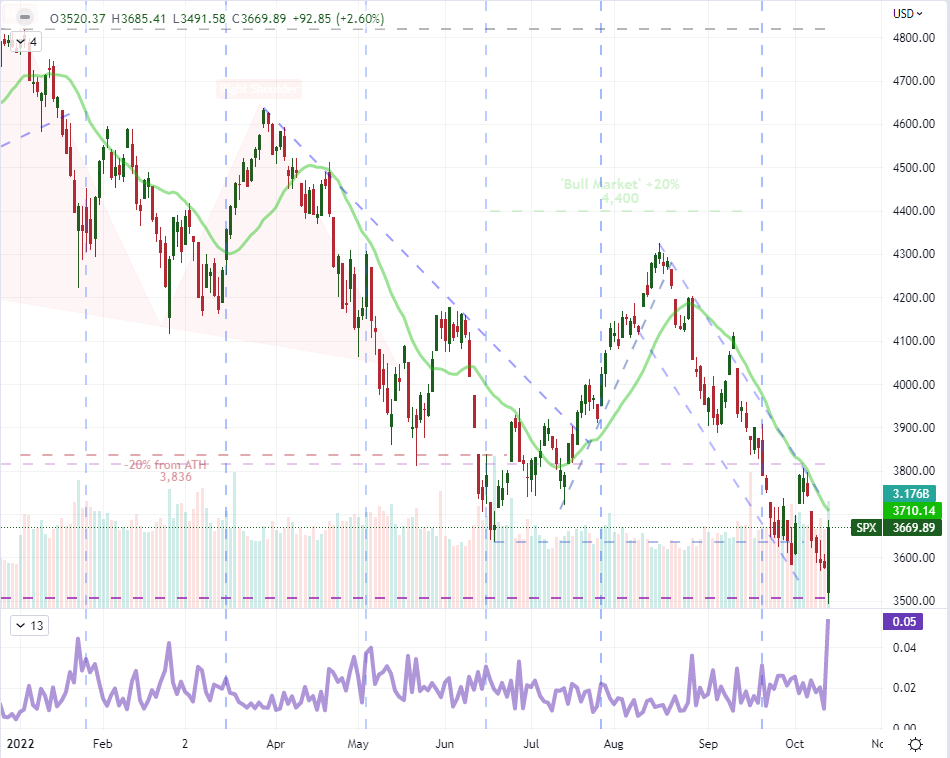
The US stock index first reacted to the US inflation report on Thursday's trading session with a -1.6 per cent gap to the negative at the open and a challenge of a 50 per cent retracement of the post-pandemic rise near 3,505.
Nonetheless, the day ended with a gain of 2.6%—consequently, SPX's largest single-day trading range (5.5%) since March 2020.
With the 20-day simple moving average and upper channel threshold above, it will be intriguing to observe the future volatility's direction.
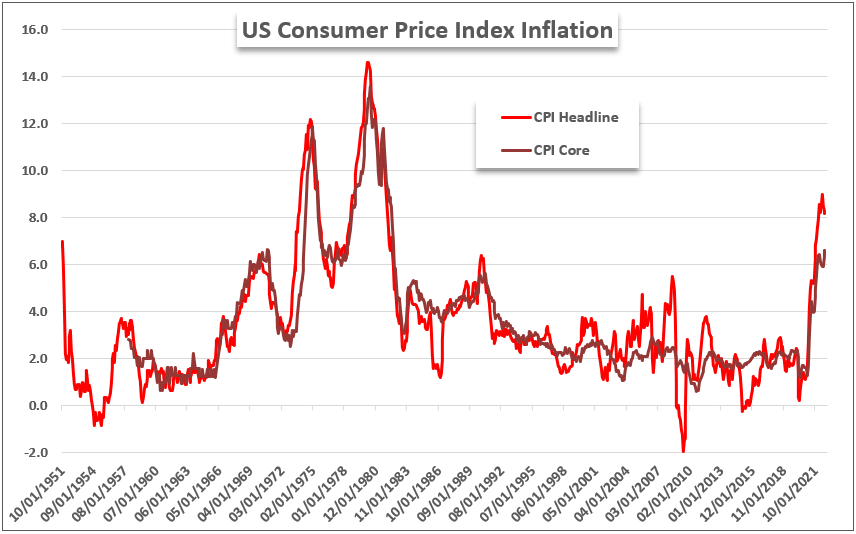
In the aftermath of a faster-than-anticipated core inflation reading of 6.6%, any fundamental market watcher will find it remarkable that this session's strong risk-on market advance occurred.
Since the early 1980s, this is the highest price pressure level for the market's most carefully studied indicator. Under "normal" conditions, such a reading would further discourage risk-taking.
Higher inflation would compel the Federal Reserve to maintain a rapid pace of monetary policy tightening, therefore tightening the financial system and undermining speculative favorites such as stocks.
Indeed, the projection for the Fed's FOMC meeting on November 2 completely prices in a 75 basis point rate rise — the fourth consecutive move of this scale from the largest central bank in the world.
It is not exactly a surprise, given that Fed estimates and language have indicated this was a likely outcome for some weeks and the IMF has reinforced the bleak economic picture.
Nonetheless, I do not view this as a solid basis for a market rise. Therefore, traders should be careful of ongoing volatility and a directionless outlook.
Those who have monitored seasonal tendencies should not be surprised by the increase in volatility. Historically, October has been the most active month regarding both market volatility and trading volume.
During the previous session, the S&P 500 volume likewise saw a notable increase, confirming that we are conforming to the norm. However, my suspicion is triggered by the norms for the performance of the underlying index.
The dispersion of directed market activity is large, and its eventual bearing is strongly dependent on market conditions in a particular year.
Historically, the SPX has averaged a gain during this month, but the current environment clearly calls the expected direction into question.
Consider that the market has seen losses in six of the first nine months of 2022, but just one of those months has traditionally averaged losses since 1980.
In an intriguing parallel to the disobedience of the US equity index, the Greenback's behavior following the inflation news would likewise be contentious.
With increased financial risk implications and rising Fed interest rate forecasts, it stands to reason that the US dollar would be expected to appreciate.
It wouldn't be out of the ordinary to prolong a well-established bull trend a bit farther, but that wasn't the eventual conclusion. In the previous session, the Dollar fell versus the Euro, the Pound, and commodity currencies.
It does not significantly affect our view of the benchmark's trajectory towards multi-decade highs, but it is disorienting. USDJPY was one area where the Dollar did not lose ground, much to the anger of Japanese officials.
The exchange rate rose for the seventh session in a row and reached the same peak recorded in August 1998. (147.67).
On September 22nd, the Japanese Ministry of Finance instructed intervention in a bid to prop up the yen, and the market's rejection of this effort is impossible to overlook.
A market's volatility tends to amplify on its own, but a targeted list of high-profile upcoming event risks undoubtedly helps to stimulate additional trading activity.
Several significant events scheduled for Friday are more than capable of producing their own volatility. In a more traditional macroeconomic route, the US docket's September retail sales data is a solid indicator of economic health.
Still, the October consumer confidence survey from the University of Michigan includes a forward-looking component.
If these results fall short of expectations, it would bolster the IMF's unfavourable growth prediction for the world's largest economy and exacerbate the pain caused by the Fed's resolve to battle inflation at the price of economic development.
As the earnings season begins in earnest, Friday will mark a big shift in emphasis. The TSM and Blackrock corporate data from the previous session supported the broad picture, but a more cohesive image of the financial system is expected later today.
It begins with JPMorgan, which tends to set the tone, but be aware of the disparities in reporting across the large banks, such as Wells Fargo's comment on home financing and Citigroup's perspective on retail banking.
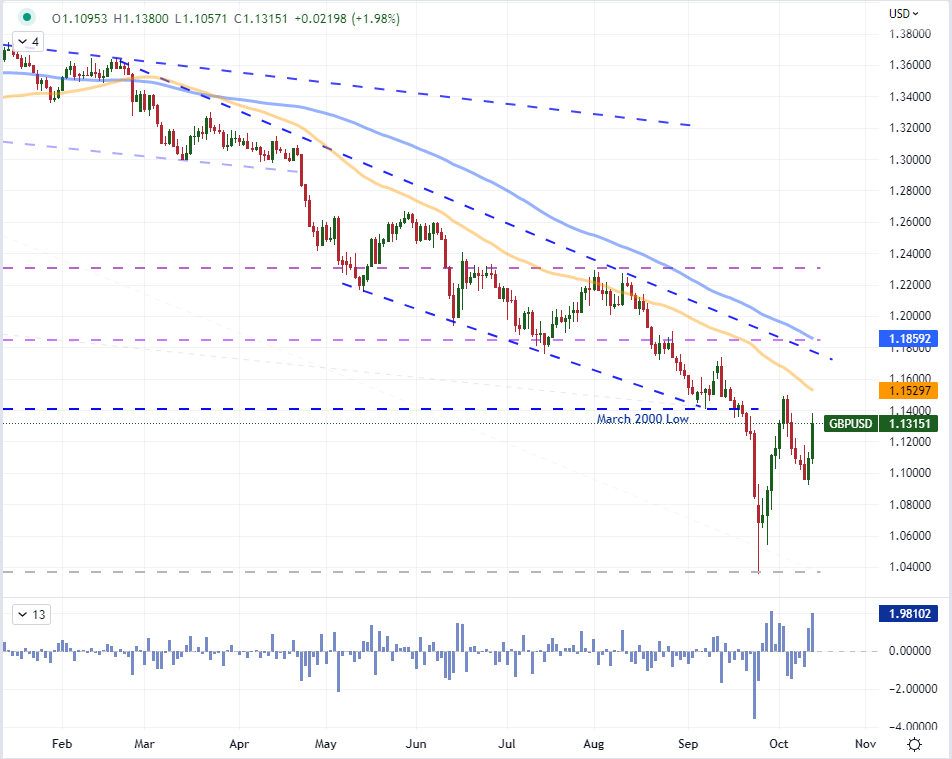
The projected closure of the Bank of England's (BOE) short-term stimulus program is an additional intriguing fundamental focus for the final trading session of the week.
In response to the negative response to the mini-budget proposed by Prime Minister Liz Truss and Chancellor Kwasi Kwarteng, the central bank implemented a liquidity plan.
Concerns persist over the debt implications of the expensive package, but the BOE has made it plain that it would let its special program expire on Friday as scheduled. Despite the recent decline in the yield on 10-year Gilts, we remain extraordinarily high.
Either the central bank or the government will need to budge, or the market may be forced to suffer the consequences of the lack of cooperation. Friday should be observed intently for GBPUSD and Sterling crosses.
|
HOT TOPICS |
|
-1664774370.jpg) |
|
 |
At The 10th Global Brands Magazine Awards, RoboForex Received An International Award |
 |