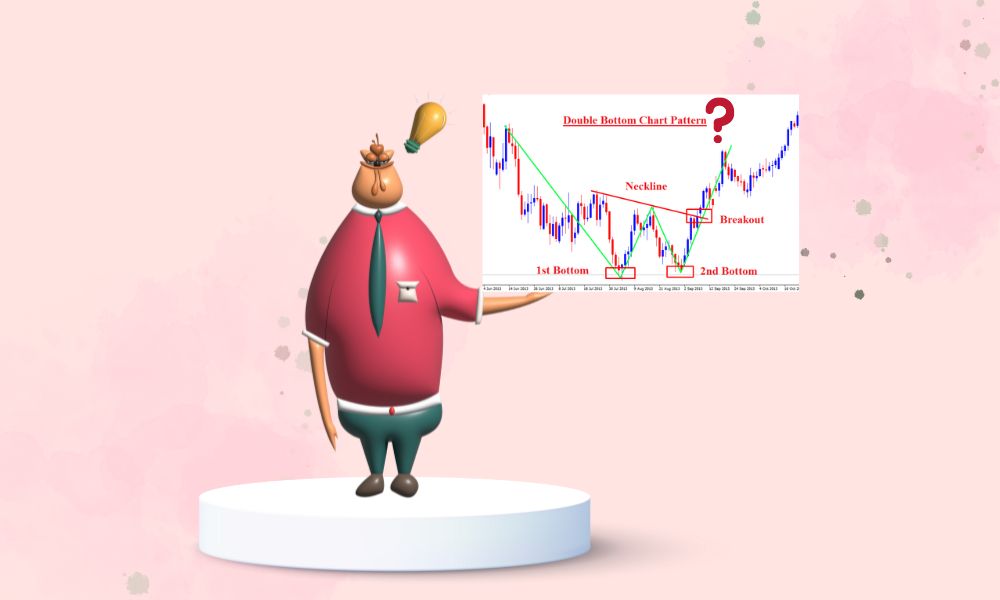
A double bottom pattern is a technical analysis charting pattern that indicates a shift in trend and a reversal of momentum from prior leading price movement.
It represents a stock or index decline, a recovery, another decrease to the same or comparable level as the first drop, and then another rebound.
The double bottom resembles the letter "W." The twice-touched low is seen as a level of support.
Most technical analysts anticipate that the first bottom should move by 10 to 20%. The second bottom should form within 3 to 4% of the previous low, with volume on the subsequent surge increasing.
A double bottom pattern, like many other chart patterns, is best suited for examining a market's intermediate- to longer-term outlook. In general, the larger the time span between the pattern's two lows, the more likely the chart pattern will be effective.
For the lows of the double bottom pattern, at least a three-month length is regarded appropriate in order for the pattern to offer a higher possibility of success. When evaluating markets for this pattern, it is therefore preferable to utilize daily or weekly data price charts.
Although the pattern may appear on intraday price charts, determining the authenticity of the double bottom pattern on intraday data price charts is quite challenging.
The double bottom pattern always occurs after a large or minor downtrend in a specific security and signifies a reversal and the start of a prospective uptrend.
As a result, the pattern should be validated by market fundamentals for the security, the sector to which the security belongs, and the market in general.
The fundamentals should show the hallmarks of an impending market reversal. Volume should also be closely checked throughout pattern creation. Volume often increases during the pattern's two upward price movements.
These volume increases are a significant indicator of upward price pressure and serve as additional evidence of a successful double-bottom pattern once the closing price is in the second rebound and approaching the high of the pattern's first rebound.
A noticeable increase in volume is currently coupled with fundamentals that indicate market conditions conducive to a reversal; a long position should be taken at the price level of the first rebound, with a stop loss at the pattern's second low.
A profit objective of two times the stop loss amount above the entry price should be set.
The inverse of double bottom patterns is double top patterns. Two consecutive rounded tops constitute a double top pattern. The first rounding top creates an upside-down U pattern.
Rounding tops are frequently an indicator of a bearish reversal since they come after a lengthy bullish run. Inferences from double tops will be similar.
When a double top happens, the peak of the second rounded top is normally significantly lower than the peak of the first rounded top, signifying resistance and tiredness.
Double tops are uncommon occurrences, with their development frequently signaling that investors are looking for final profits from a strong trend.
Double peaks frequently result in a negative reversal, which allows traders to profit by selling the stock during a decline.